Watch-O-Scope is a combination of hardware and Windows-compatible software for diagnosing, testing, and regulating mechanical watches. It is based on the same concepts as stand-alone electronic watch timers, but uses the power of the modern PC to provide features that mid-20th century watchmakers could only dream of. Watch-O-Scope is comparable in features to very high-end dedicated watch timing machines costing thousands, but at a price point below that of introductory level hobbyist watch timers.
This user manual assumes basic familiarity with the concepts of watch timing machines, and the sounds that a watch produces which makes such a device possible.
Watch-O-Scope is very easy to use. For basic watch timing operations, one need only put the watch into a connected watch test stand, turn it on, and click one button. When needed, an intuitive user interface also gives access to a variety of more powerful features.
Watch-O-Scope consists of two components:
Installing the software is simple. Just tap the download button,
save it to your computer, run it, and follow the installation instructions.
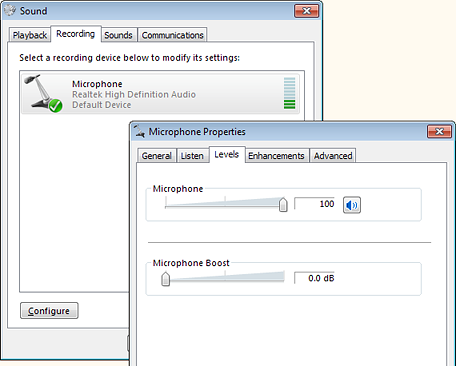 Watch-O-Scope uses your PC's sound card to receive the watch sounds from your
test stand or home-built amplifier, so some additional configuration may be
necessary. Open the Sound applet from the Windows Control Panel, find
the Recording settings, and select the recording device (Line In
or Microphone) to which the test stand or amplifier is connected. Click
the Properties button, and ensure that the level on the Levels
tab is set to maximum. If there is a Boost setting, set this to zero.
Watch-O-Scope uses your PC's sound card to receive the watch sounds from your
test stand or home-built amplifier, so some additional configuration may be
necessary. Open the Sound applet from the Windows Control Panel, find
the Recording settings, and select the recording device (Line In
or Microphone) to which the test stand or amplifier is connected. Click
the Properties button, and ensure that the level on the Levels
tab is set to maximum. If there is a Boost setting, set this to zero.
If your device has an Enhancements tab as does the one shown here, ensure that all enhancements and special effects, such as noise suppression and echo cancellation, are turned off, as these will interfere with the unaltered watch sounds needed for precise timing.
Depending on which version of Windows you are using, your settings windows might look different than the ones shown here (Windows 7).
Place a running watch, dial up, onto the test stand or home-built microphone stand. (If using the home-built stand, lightly tighten the thumbscrew so that the crown is pressed against the element. It should be just tight enough that the watch will not fall out if you turn the microphone stand upside-down. Overtightening could damage the microphone element.)
Turn on the test stand or amplifier and start the Watch-O-Scope program, either from the Windows Start menu or from the desktop if you elected to have the installer put an icon there.
Click the Scope Mode button (the second magenta coloured button) or press S on your keyboard, and you should see a repeating oscilloscope-like trace as shown below. The numbers at the top are not meaningful at this point, and will not likely correspond with what the watch is doing.
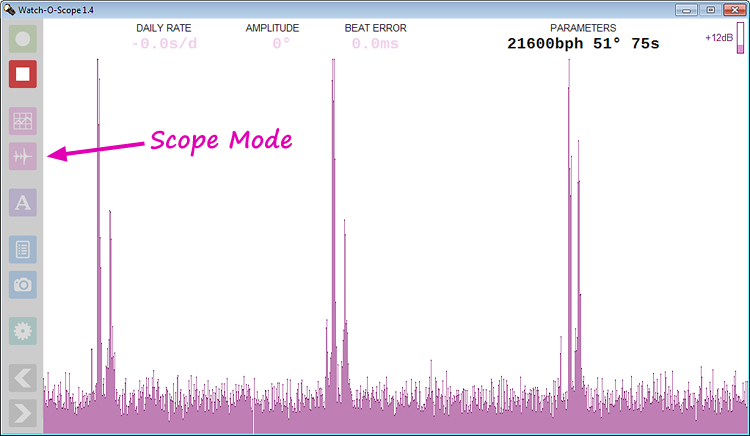
If you do not see such a trace, check the connection of your test stand or home-built microphone and amplifier. If you still do not see a trace, you may have to specify the audio input device that is being used in Watch-O-Scope's Settings window.
If the trace is very small, just a few pixels near the bottom of the window, try pressing the + key on your keyboard one or more times. This will increase Watch-O-Scope's internal volume boost. The amount of boost, shown by the indicator at the top right corner of the window, can range from 0 to 48 decibels. It can be adjusted up or down using the + and − keys.
If the trace is too large and cut off at the top of the window, first try decreasing the volume boost using the − key. If the boost is zero and the trace is still being cut off, the actual input signal may be too strong, which can happen when using a computer's microphone input. Reduce the level for that input in the Windows Control Panel until the trace takes up about half the height of the window.
If everything is working, click the red Stop button or press Esc on your keyboard. You are now ready to use Watch-O-Scope. Before using it for actual watch work, you should calibrate it to your sound card's clock rate, but it is suggested you experiment with the program a bit first to understand how to use it.
All of Watch-O-Scope's controls are grouped vertically along the left side of the window to take up as little space as possible. You can access a control either by clicking on it with your mouse (or finger if you are using a touch screen), or by pressing its corresponding shortcut key on your keyboard.
The top two buttons are used to start, pause, resume, and stop basic watch timing functions.
 Clicking the green Start button, or pressing the
Space bar on your keyboard, will start a watch
timing operation. Watch-O-Scope will analyze the audio signal for a
few seconds to determine the appropriate thresholds to use to detect ticks,
determine or verify the nominal rate of the watch, and then begin displaying
a traditional paper tape style trace.
Clicking the green Start button, or pressing the
Space bar on your keyboard, will start a watch
timing operation. Watch-O-Scope will analyze the audio signal for a
few seconds to determine the appropriate thresholds to use to detect ticks,
determine or verify the nominal rate of the watch, and then begin displaying
a traditional paper tape style trace.
 Immediately after you click Start, the red Stop button will be
enabled. You can click this at any time (or press the
Esc key) to terminate the operation. The
Stop button is also used to terminate other operations, namely Scope
mode and Long Term testing mode.
Immediately after you click Start, the red Stop button will be
enabled. You can click this at any time (or press the
Esc key) to terminate the operation. The
Stop button is also used to terminate other operations, namely Scope
mode and Long Term testing mode.
 Once the trace begins, the Start button will change into an orange
Pause button. Clicking this (or pressing the
Space bar) will stop the trace and turn the
Pause button into a yellow-green Resume button.
Once the trace begins, the Start button will change into an orange
Pause button. Clicking this (or pressing the
Space bar) will stop the trace and turn the
Pause button into a yellow-green Resume button.
 Clicking Resume (or again, pressing the
Space bar) will start a new trace on a new "page",
without going through the level and rate determination steps. Typically, one
uses Pause and Resume when testing a watch in multiple
positions.
Clicking Resume (or again, pressing the
Space bar) will start a new trace on a new "page",
without going through the level and rate determination steps. Typically, one
uses Pause and Resume when testing a watch in multiple
positions.
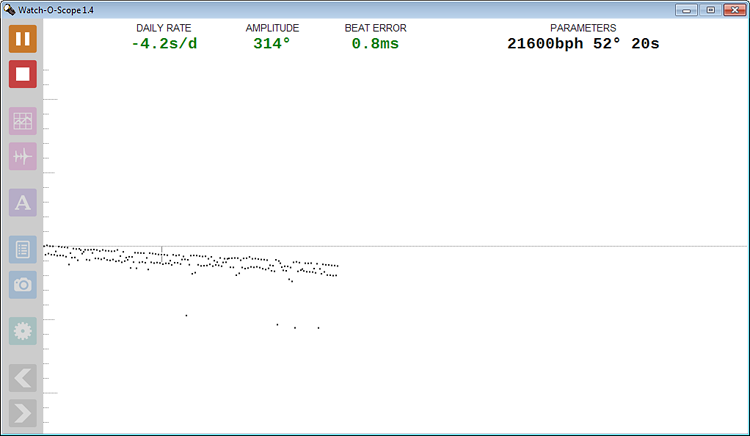
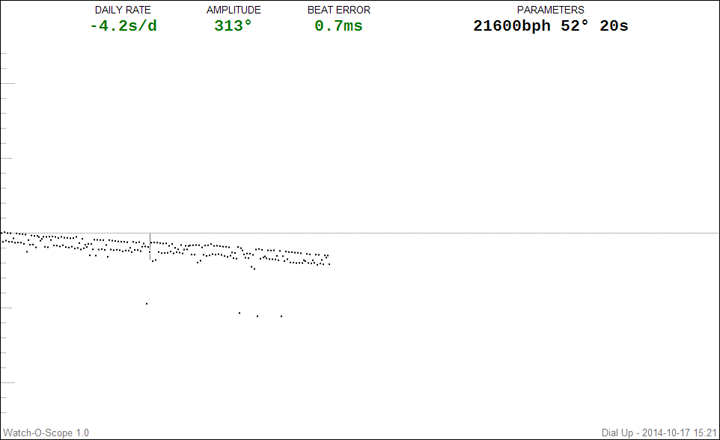
The displayed daily rate, balance amplitude, and beat error are averaged over a period of time (20 seconds if you haven't yet changed this setting). If that much time has not yet passed, the numbers are displayed in red. Once enough ticks have been collected, the numbers change to green, and a vertical line appears in the trace indicating the beginning of the current averaging period (i.e. all the ticks between there and the rightmost were taken into account in computing the displayed numbers).
A watch that is running exactly at its nominal rate and with no beat error would produce a single row of dots exactly along the centre line of the display. If the row of dots is angled downward, the watch is slow. If upward, the watch is fast. Two parallel rows of alternating dots indicate a beat error. Because individual screen pixels are so small, Watch-O-Scope uses a 2×2 block of screen pixels to represent a dot, although it can position these dots with sub-pixel resolution.
The indices along the left side of the trace indicate milliseconds. Using these as a guide, you can estimate beat error visually when an overly noisy watch prevents the software from computing an accurate average.
Whenever you press Start or Resume, or the trace reaches the rightmost edge of the window and starts over on the left, Watch-O-Scope starts a new "page". The last ten pages are always accessible for review.

 Once there is more than one page, the grey Previous Page and/or Next
Page buttons are enabled whenever Watch-O-Scope is stopped or
paused. You can click these buttons, or use the
← and → keys on
your keyboard, to flip between pages.
Once there is more than one page, the grey Previous Page and/or Next
Page buttons are enabled whenever Watch-O-Scope is stopped or
paused. You can click these buttons, or use the
← and → keys on
your keyboard, to flip between pages.
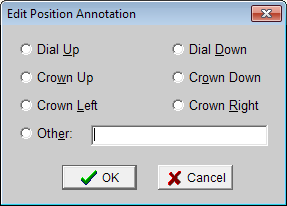
 Each page can be annotated with text of your choice by clicking the purple
Annotate button or pressing A on your
keyboard. This opens a window where you can select a predefined position
annotation, or type anything you want:
Each page can be annotated with text of your choice by clicking the purple
Annotate button or pressing A on your
keyboard. This opens a window where you can select a predefined position
annotation, or type anything you want:
Once a page has been annotated, the annotation, along with the date and time that the page was completed, is displayed at the bottom right corner of the page.
When you exit Watch-O-Scope, all the pages (up to ten) and their annotations are automatically saved to disk. The next time you use Watch-O-Scope, these pages will be reloaded and you can review and/or annotate them as before.
If you want to start with a clean slate when you begin testing a new watch, pressing the Clear Pages button in the Settings window will clear all the saved pages.
Watch-O-Scope has a very simple yet powerful and flexible facility for generating watch testing reports, such as a test in six positions. Basically, any or all of the saved pages can be incorporated into a report, in any order, and optionally with weighting applied to the computed quantities from that page.
 Clicking the blue Generate Report button, or pressing
R on your keyboard, opens the report window, which
displays a table summarizing the information from all of the stored pages:
Clicking the blue Generate Report button, or pressing
R on your keyboard, opens the report window, which
displays a table summarizing the information from all of the stored pages:
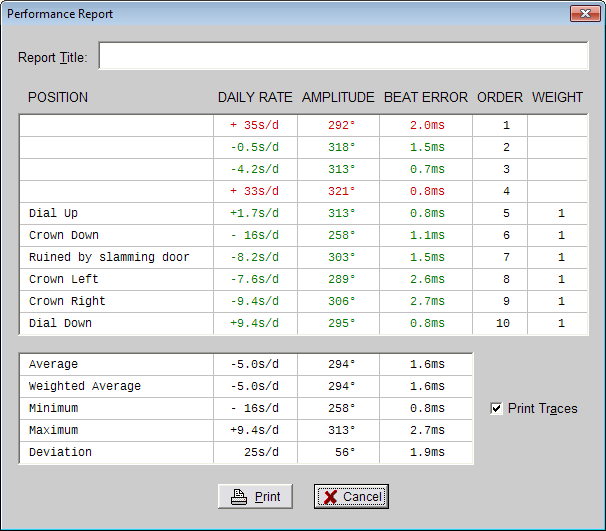
The POSITION, ORDER, and WEIGHT columns can be edited, like cells in a spreadhseet.
Starting from the right, the WEIGHT column determines whether or not a particular page will be included in the report. If the weight is not blank, the page will be included. Initially, the weight of every page that has been annotated will be set to 1. The weight determines how much that page contributes to the weighted average. When all the weights are 1, the weighted average is the same as the simple average, and will not appear on the printed report.
The ORDER column determines the order in which the pages will be incorporated into the report. Initially, this is the order in which the pages were created. You can type numbers into this column to change the order. Any numbers will do, as it is only their relative order that matters, and then only for the pages that will actually be used (the ones with a non-blank weight).
The POSITION column is initially filled in with each page's annotation, but can be edited for the purposes of the report (the original annotations are not changed).
Below, the weight of the page that was annotated as "Ruined by slamming door" has been blanked out, and the weight of the "Dial Up" test has been increased to 4 because this watch spends most of its time dial up (over night, and also much of the day on its programmer owner's wrist). The order has been changed to "Dial Up", "Dial Down", "Crown Left", "Crown Right", and "Crown Down".
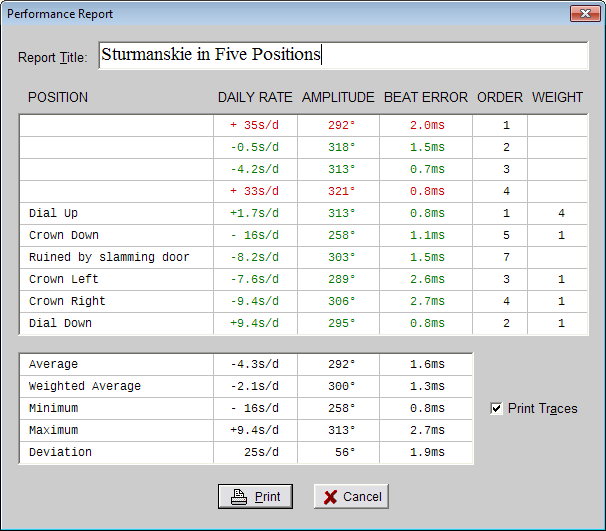
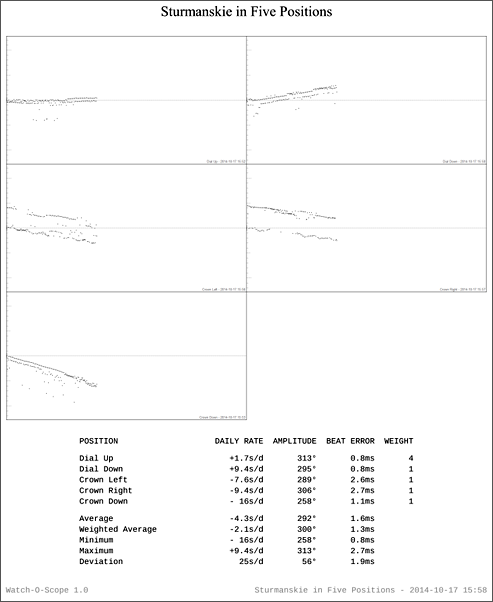
A title has been entered into the Report Title field, and the Print Traces option has been left checked so that the actual traces will appear on the report. This is what the resulting report looks like:
 Instead of generating a full report, sometimes all that is needed is to
capture the result of one timing test. Clicking the blue Save Image to
File button, or pressing F on your keyboard,
will save the currently displayed page as a PNG (Portable Network Graphics)
file, which can be e-mailed or shared on the Web.
Instead of generating a full report, sometimes all that is needed is to
capture the result of one timing test. Clicking the blue Save Image to
File button, or pressing F on your keyboard,
will save the currently displayed page as a PNG (Portable Network Graphics)
file, which can be e-mailed or shared on the Web.
The features described so far are all you need for most watch testing and adjusting, but Watch-O-Scope provides some capabilities that can be useful for more advanced diagnostics.
 We've already used scope mode during the initial setup to determine that
the microphone and amplifier were working, and the computer's sound card was
configured correctly. Start scope mode by clicking the magenta Scope
Mode button or by pressing S on your keyboard.
We've already used scope mode during the initial setup to determine that
the microphone and amplifier were working, and the computer's sound card was
configured correctly. Start scope mode by clicking the magenta Scope
Mode button or by pressing S on your keyboard.
Scope mode shows you the sounds produced by the watch in real time, much like an oscilloscope can do. Unlike an oscilloscope, scope mode takes what would be the lower half of the audio signal and flips it, combining it with the upper half. This combined signal is the same one that Watch-O-Scope performs its analyses on.
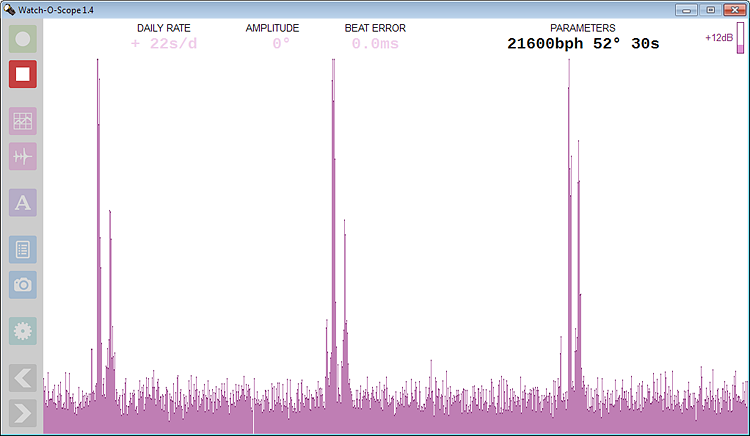
If you have previously done a timing test since starting Watch-O-Scope, the threshold level that was used is shown as a dotted horizontal line. If you have not yet done a timing test, the dotted line will be at the top of the display area.
The displayed daily rate, amplitude, beat error, and nominal beat rate are also from the most recent timing test, and are only shown for reference. They do not reflect what you are currently seeing in scope mode (which is why they are displayed very dimly).
In order to produce a stable display in scope mode, you can set the Scope Sweep Time in the Settings window. The sweep time should be some multiple of the watch's tick interval, and can be specified as an integer, decimal fraction, or common fraction.
For example, a watch that has a beat rate of 28800 beats per hour will tick 8 times per second, giving a tick interval of 1/8 of a second. Setting the sweep time to any of 4/8, 1/2, or 0.5, will cause four ticks to appear during each sweep. If the watch is running exactly at the right rate, these ticks will hold their position. If the watch is running fast, they will drift slowly to the left, whereas a slow watch will have the ticks drifting right.
Generally, it is best to use an even multiple of the tick interval, so that even ticks always appear in one set of positions, and odd ticks (tocks) in another. Sometimes, setting a sweep rate that is an odd multiple of the tick interval can be useful in diagnosing beat error. If the watch is perfectly in beat, the display will still be stable, but if the watch is out of beat, the displayed ticks will jump back and forth.
Click the Stop button to freeze the scope mode display. If you look
closely at the stopped display, you'll notice that one column is white,
indicating where in the sweep the display was stopped. Everything to the
right of this is from the previous sweep.
Unlike timing tests, scope mode displays are not saved to pages. Once you initiate any operation that clears the display, the previously displayed scope mode output is lost. However, you can save the scope mode display while it is still visible using the Save Image to File button.
The algorithms used by Watch-O-Scope to initially analyze the watch sounds in order to determine the best threshold level at which to register a tick are quite sophisticated, and can almost always "lock on" to what they hear. Once in a while however, a watch comes along with slightly erratic levels which can throw off the automatic level determination.
The Settings window provides an option, "Adjust threshold level manually", to allow manual intervention during level determination. When a watch timing test is started with that option enabled, Watch-O-Scope will perform a level and rate determination as usual, but before beginning the actual test, will give you an opportunity to manually adjust the threshold level:
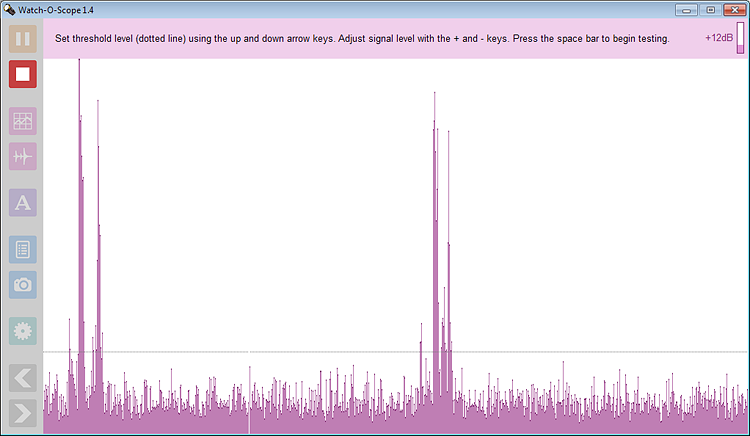
The display is identical to that of scope mode, except that the sweep rate is automatically set to show two ticks per sweep, resulting in a stable display. A dotted horizontal line indicates the predetermined threshold level. You can move this up or down using the ↑ and ↓ keys. Pressing an arrow key in conjunction with the Shift key will move the level five steps at a time. You can also increase or decrease Watch-O-Scope's internal volume boost at this time using the + and − keys.
The ideal level is one which intercepts the first of the three sounds made by each and every tick, but remains above any noise immediately preceding these sounds (within the last 10% of the interval between ticks).
Once you are satisfied with the level, press the Space bar to begin the timing test.
Sometimes, a watch can defy all attempts to analyze it. Its sounds levels can vary so much that ticks during one period of time might be quieter than the background noise during other time periods. For such watches, determining an exact threshold level is not possible. Fortunately, Watch-O-Scope has an answer even for these cases.
By checking the box next to "Plot raw watch sounds instead of analyzed ticks" in the Settings window, Watch-O-Scope will switch to a mode where, instead of a single dot, each column on the display will display the sound level during the entire tick interval (the Vertical Scale setting is ignored in this mode). In effect, this is like looking at consecutive ticks in scope mode, stacked side by side, and then viewed from above.
In addition to allowing testing of watches that defy analysis using the regular dot-per-tick mode, raw mode also lets you see a lot of things that the ordinary timing mode does not show. In the example above, one can see the vastly different levels for the odd and even ticks. Any time there is any sort of vertical striping visible, it indicates a difference between consecutive ticks.
This manual cannot go into a detailed exposition of everything that can be determined by raw mode. Careful thought, an understanding of how the escapement and balance wheel work, and a hypothesis about what might be wrong with a watch will increase this feature's utility over time. The author has found this mode to be so useful, that he generally uses it all the time, even when simply regulating a watch.
 A watch rarely runs at a consistent rate throughout its power reserve.
Depending on the quality and condition of the watch, the rate can fluctuate
even over shorter periods. The long term test mode lets you monitor the rate
over a longer time period to observe such fluctuations. Start a long term
test by clicking the magenta Long Term button or pressing
L on your keyboard.
A watch rarely runs at a consistent rate throughout its power reserve.
Depending on the quality and condition of the watch, the rate can fluctuate
even over shorter periods. The long term test mode lets you monitor the rate
over a longer time period to observe such fluctuations. Start a long term
test by clicking the magenta Long Term button or pressing
L on your keyboard.
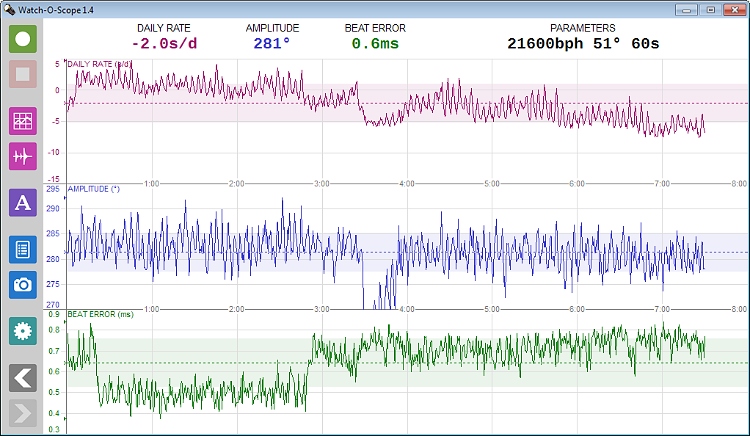
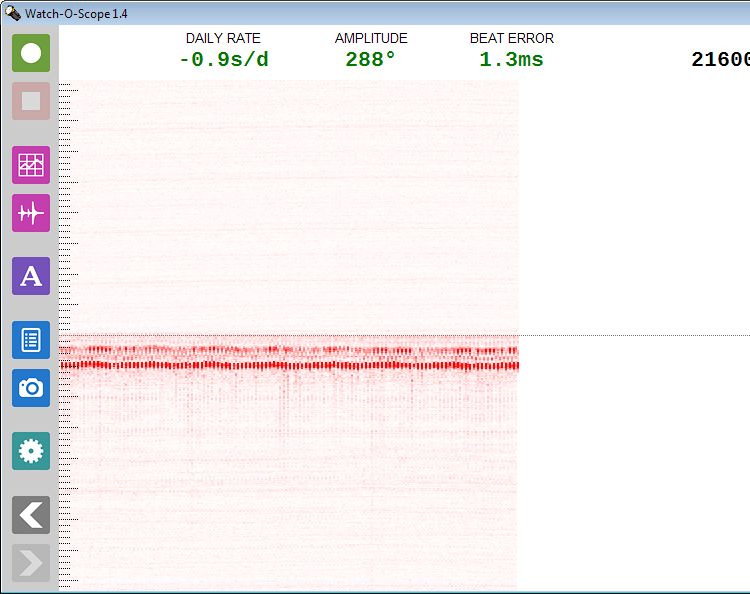
The example above illustrates a seven-and-a-half hour test of a Poljot 3133 chronograph movement, which is equipped with a date complication. The test was started when the watch was showing 8pm. As the mechanism starts to collect energy to change the date, the amplitude drops and the watch speeds up. Interstingly, the beat error is affected as well. There also appears to be a slight cyclic fluctuation in rate every two hours, visible between the 4:00 and 7:00 hour marks.
The graph includes a number of features to help understand the performance of the watch:
If you're not well versed in statistics and don't understand all of the above, don't worry about it. Just looking at the graphs themselves will show you what you need.
When a long term test is started, Watch-O-Scope will determine the level and rate as usual, unless the long term test was started from a regular timing test that was paused. In that case, it will use the level and rate already determined for that test (just as resuming from a paused test would do).
During a long term test, Watch-O-Scope continuously monitors the performance of the watch and records the current average results (as defined by the averaging period) every 30 seconds, displaying them on a chart. After more than 8 hours have elapsed, all existing pairs of results are averaged and recording switches to once every 60 seconds. After a total of 16 hours, recording happens every 120 seconds, and so on. This way, a long term test can go on for as long as desired. If the watch stops running, testing will stop automatically, so this is also a great way to test power reserve.
Long term test mode uses the same averaging period that a regular timing test uses. Until that averaging period has elapsed, the daily rate, amplitude, and beat error will be displayed in red and updated continuously. Once the averaging period has elapsed, these values will be displayed in purple, blue, and green respectively, corresponding to the colours used in the long term chart, and will only be updated when a new data point is added to the chart. Selecting an averaging period that is much longer than the long term update interval (which always starts out as 30 seconds) will result in "smoothing" of the graph.
 The Settings window has already been mentioned in conjunction with
the various features that it affects. All the settings are described here in
one place for convenient reference.
The Settings window has already been mentioned in conjunction with
the various features that it affects. All the settings are described here in
one place for convenient reference.
To open the Settings window, click the teal Settings button or press the Tab key on your keyboard.
The settings are grouped into related functions.
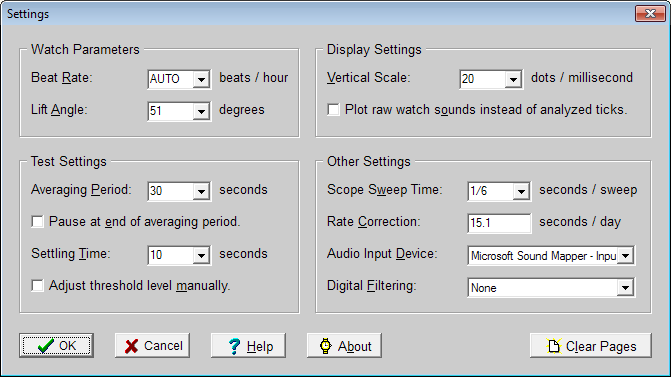
When you have finished changing the settings, click the OK button to accept the changes, or Cancel to discard the changes.
The Settings window also contains the Clear Pages button, which will clear all the recorded pages of traces and timing information. This button is tucked away in the Settings window to make it less likely that it will be clicked accidentally, as this operation cannot be undone.
This group of settings describes the watch being tested.
Use this field to specify the nominal beat rate of the watch being tested. You can either select one of the rates from the drop-down list, or type in any rate between 300 and 43200 beats per hour.
Instead of specifying a beat rate, you can also select AUTO and allow Watch-O-Scope to auto-detect the beat rate if it is one of the common rates (18000, 19800, 21600, 25200, or 28800 beats per hour).
This is the angle through which the balance wheel rotates while being propelled by the escapement. Watch-O-Scope needs to know the lift angle in order to be able to determine the balance wheel amplitude. You can select or type any integer lift angle from 30 to 70 degrees. If the watch you are testing has a non-integer lift angle, choose the nearest integer.
Selecting an incorrect lift angle will affect only the amplitude determination; daily rate and beat error will still be computed correctly.
These settings control the testing conditions.
During a timing test, Watch-O-Scope averages the watch's performance over the specified averaging period. This can range from 2 to 600 seconds.
When regulating a watch, a shorter averaging period means that Watch-O-Scope will respond more quickly to changes in regulation. However, no watch is perfectly consistent from one tick to the next, or even from one second to the next, so a short averaging period will result in (sometimes rapid) fluctuation of the displayed quantities. Generally, an averaging period of 20 or 30 seconds is appropriate.
Checking the box next to this option will cause a timing test to pause (as if the Pause button had been clicked) when a full averaging period has been reached.
When testing a watch in multiple positions for the purposes of generating a timing report, this is a convenient way to keep the trace for each position on its own page. Up to 480 ticks fit on a page, so an averaging period of 480 divided by the number of ticks per second will fill a page.
This is the amount of time that Watch-O-Scope will spend analyzing the watch sounds in order to determine the optimal tick detection threshold level and the nominal rate of the watch. This can be set to anywhere from 5 to 30 seconds. The longer the time, the better Watch-O-Scope can compensate for periodic variations in the sound levels produced by the watch.
Selecting this option will let you increase or decrease the automatically determined threshold level before commencing a timing test. This is described in detail in the Manual Threshold Level section of this manual.
The Vertical Scale setting determines how many "dots" represent each millisecond vertically. A dot is two screen pixels high and wide so it is large enough to easily see. On a typical desktop monitor which has a resolution of about 4 pixels per mm (100 pixels per inch), a dot corresponds to approximately 0.5mm (0.02 inches). Allowable scales are from 1 to 20 dots per millisecond.
Choosing this option turns on Raw Watch Sounds Mode. In this mode, the vertical scale setting is ignored (and cannot be changed). Instead, the height of the display area corresponds to an entire tick interval, and the vertical scale is automatically set based on the beat rate to accommodate this.
When using scope mode, this setting controls the period of time covered by one full sweep across the display. For a stable display, this should be a multiple of the tick interval time of the watch being tested. You can select one of the predefined sweep times, or enter a time.
Sweep times can be entered either as an integer, a decimal fraction, or a common fraction (using "/" to separate the numerator and denominator). The latter makes it easy to enter sweep times that have no exact decimal representation, such as 2/3. In general, a fraction x/y will display x ticks of a watch that ticks y times per second.
The denominator can even be a decimal fraction itself. For example, a sweep time 4/5.5 of will display 4 ticks per sweep for a watch that ticks 5.5 times per second (19800 beats per hour).
This field is used to specify the error inherent in the PC's sound card sampling rate, expressed in seconds per day. Any number from -100.0 to +100.0 can be entered. Please refer to Calibrating Your Sound Card Clock below for details.
Many sound cards have more than one audio input, for example, a line level input and a microphone input. Use this field to select the input to which you have connected the Watch-O-Scope amplifier. The first input device in the list is always "Microsoft Sound Mapper - Input", which refers to a virtual input mixer provided by most sound card drivers. If you select this device, then the actual input is selected by adjusting the volume controls in the mixer, separately from Watch-O-Scope.
If the signal from your microphone and amplifier is especially noisy, turning on digital filtering may help. This setting has three options:
Selecting one of the three filtering options will apply an aggressive (24dB per octave) filter to the audio data to restrict it to that range of frequencies before doing any further processing. The wide band filter is suitable for most applications, but if there is excessive noise in the environment, or the microphone and amplifier are picking up AC hum, the medium or narrow filter may improve things further.
If after selecting one of the filtering options, you find that Watch-O-Scope acts erratically, it may be that your computer is not powerful enough to perform the digital filtering in real time, although most any PC made since 2005 should be able to handle this (it has even been used successfully on a 500MHz Pentium III system manufactured in 1999).
PC sound cards have their own crystal oscillator which is used to control the audio sampling rate (for example, the 44100 samples per second used to achieve CD quality). Unfortunately, these oscillators are not terribly precise, and errors of ±0.01% are common. That may not sound like much, and is imperceptible for the reproduction of speech or music (record and tape players had far more speed variation than that).
Because Watch-O-Scope relies on the sound card's sampling rate in order to determine the time that a tick occurs, any errors in the sampling rate will result in misreported rate errors of the watch. In this application, a sound card rate error of ±0.01% corresponds to a watch rate error of ±9 seconds per day, which is not acceptable.
Fortunately, the sample rate is reasonably stable, so once the amount of error is known, Watch-O-Scope can compensate for it. In order to determine the amount of the error, Watch-O-Scope must test a watch with a known and stable rate. A thermo-compensated high accuracy quartz analog watch (one that ticks) is ideal for this, although any quartz watch whose room temperature rate is known will do.
Follow these steps to determine the rate correction:
An alternate way to determine the rate is using an external source of high accuracy audio pulses, feeding these directly into the sound card input. For example, some GPS receivers can output a train of either 1 or 5 pulses per second. Allowing Watch-O-Scope to test these pulses (with the beat rate set appropriately) will clearly show the sound card's rate error.
Note: If you change sound cards (for example, changing from your computer's built-in sound card to an external USB audio card), you will have to redo the calibration.
Copyright © 2014-2022 by Stefan Vorkoetter and Capable Computing, Inc.
All rights reserved. Unauthorized duplication prohibited.
Watch-O-Scope is a trademark of Capable Computing, Inc.
Last updated on Sunday May 29, 2022.